Inspection Reporting Software That Allows You to Make Data-Driven Decisions
Identify inspection trends, track compliance with standards and identify areas for improvement.
Inspection Reporting Software With Real Time Visibility
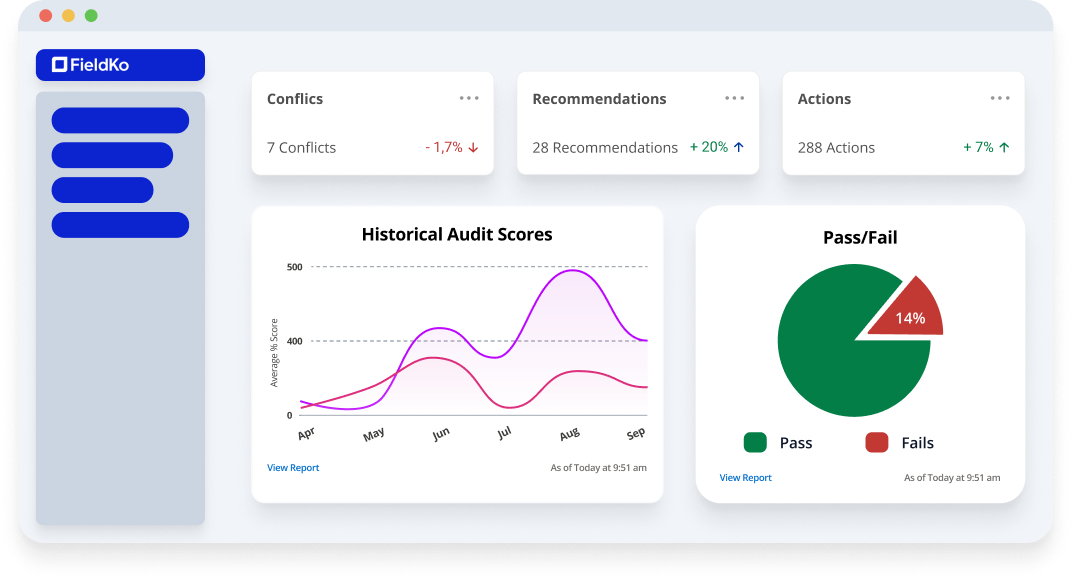
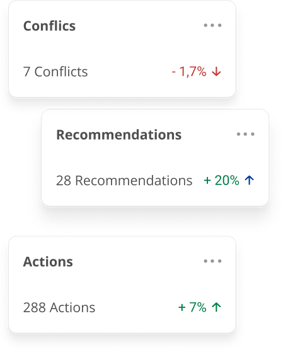
FieldKo's Reports provide real-time visibility into inspection results, allowing stakeholders to track progress, identify trends, and make informed decisions. Dashboards give team members an 'at-a-glance' view of key metrics and performance indicators, allowing stakeholders to quickly and easily visualise trends based on the latest data. With real time visibility into inspection results, stakeholders can stay up to date on the latest developments and respond quickly to any issues that arise
Report on Your Compliance Requirements
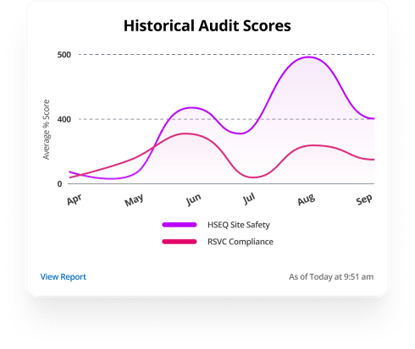
Track compliance compliance to regulations and standards and your inspection goals through configurable reports. Use analytics to take corrective action before issues arise and develop insights into areas of strength and weakness
Define your reporting criteria
Reporting and dashboards can be configured to meet the specific needs of your organisation, allowing users to focus on the metrics and KPIs that are most relevant to their role or function. Leverage the different types of standard report formats including tabular, summary, matrix, joined, and custom report types. Apply filters and groupings to the report to further refine the data
Access analytics from any device
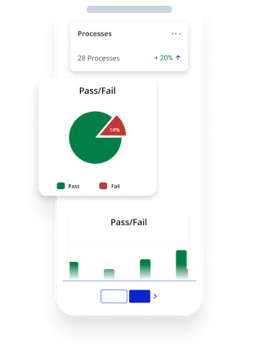
FieldKo's reports and dashboards can be shared with other users and also accessed from any device, anywhere, allowing your team to view and analyse inspection data on-the-go, in real-time. Reports can also be scheduled to be sent automatically to specific users or groups on a regular basis
Got questions?
What are FieldKo reports and dashboards?
FieldKo reports and dashboards are tools that enable users to analyse and visualize data stored in FieldKo. Reports allow users to pull data from different objects in FieldKo and present it in a tabular format. Dashboards provide a visual representation of data, allowing users to view key metrics and performance indicators at a glance.
How do I create a report in FieldKo?
To create a report in FieldKo, go to the Reports tab and click New Report. Select the object you want to report on, choose the report type, and select the fields you want to include in the report. You can also apply filters and groupings to the report to further refine the data.
What are the different types of reports in FieldKo?
There are several different types of reports in FieldKo, including tabular, summary, matrix, joined, and custom report types. Tabular reports display data in a simple table format, while summary reports provide a summary view of data grouped by a specified field. Matrix reports display data in a grid format, while joined reports allow users to combine data from multiple report types. Custom report types allow users to create custom report templates based on specific objects and relationships in FieldKo.
How do I create a dashboard in FieldKo?
To create a dashboard in FieldKo, go to the Dashboards tab and click New Dashboard. Choose the components you want to include in the dashboard, such as charts, tables, and gauges. You can also customize the layout and appearance of the dashboard to suit your needs.
How can I share reports and dashboards with others in FieldKo?
You can share reports and dashboards with other users in FieldKo by creating a public link, sharing the report or dashboard with specific users or groups, or embedding the report or dashboard in a FieldKo record or external website. You can also schedule reports and dashboards to be sent automatically to specific users or groups on a regular basis.
Can I export FieldKo Reports and Dashboards?
Yes, you can export FieldKo reports and dashboards in several formats, including Excel, CSV, PDF, and XML. This can be useful for sharing data with users who do not have access to FieldKo or for creating custom reports and visualizations outside of FieldKo.
Can I schedule reports and dashboards to run automatically?
Yes, you can schedule reports and dashboards to run automatically at a specified time and frequency. This can be useful for sharing data with users who need regular updates or for monitoring key metrics and performance indicators on an ongoing basis.
How can I customise the appearance of my reports and dashboards?
You can customize the appearance of your reports and dashboards by choosing a theme, selecting colours and fonts, and adding images and logos. You can also customize the layout and structure of the report or dashboard to suit your needs.
Can I use FieldKo reports and dashboards on mobile devices?
Yes, FieldKo reports and dashboards are fully responsive and can be accessed from any device, including smartphones and tablets. The FieldKo mobile app also provides a mobile-optimized view of reports and dashboards, allowing users to view and analyse data on-the-go.
How can I use FieldKo reports and dashboards to improve my business?
FieldKo reports and dashboards can provide valuable insights into key metrics and performance indicators, enabling users to make data-driven decisions to improve business outcomes. By tracking progress towards goals, identifying trends and patterns, and monitoring performance over time, organisations can optimise resource allocation, improve customer satisfaction, and drive revenue growth. Overall, FieldKo reports and dashboards can be a powerful tool for improving business performance and achieving strategic objectives.
“What I like most about FieldKo is the sophistication of the solution and the ability to tailor the system to our requirements.”
